MediCarePLC Admin Dashboard
Project Overview
The MediCarePLC Admin Dashboard was built from the ground up as a powerful central management system for a pharmaceutical e-commerce and inventory platform. Since the customer-facing platform runs on a Flutter mobile application, this web dashboard serves as the main control center for managing orders, monitoring inventory, tracking business performance, and handling user management.
To support long-term growth and scalability, we developed the dashboard using Next.js (App Router) and TypeScript, ensuring a reliable and maintainable codebase with strong type safety. For efficient data handling, we implemented Redux Toolkit as our global state management solution, enabling real-time interface updates, optimized data caching, and smooth state management across different sections of the dashboard.
The entry point of the application is a secure gateway. I designed the form using react-hook-form to ensure smooth validation before hitting our API endpoints. If an unauthorized user attempts to gain access, a custom validation state triggers a distinct alert component at the bottom, advising them to contact the system administrator.

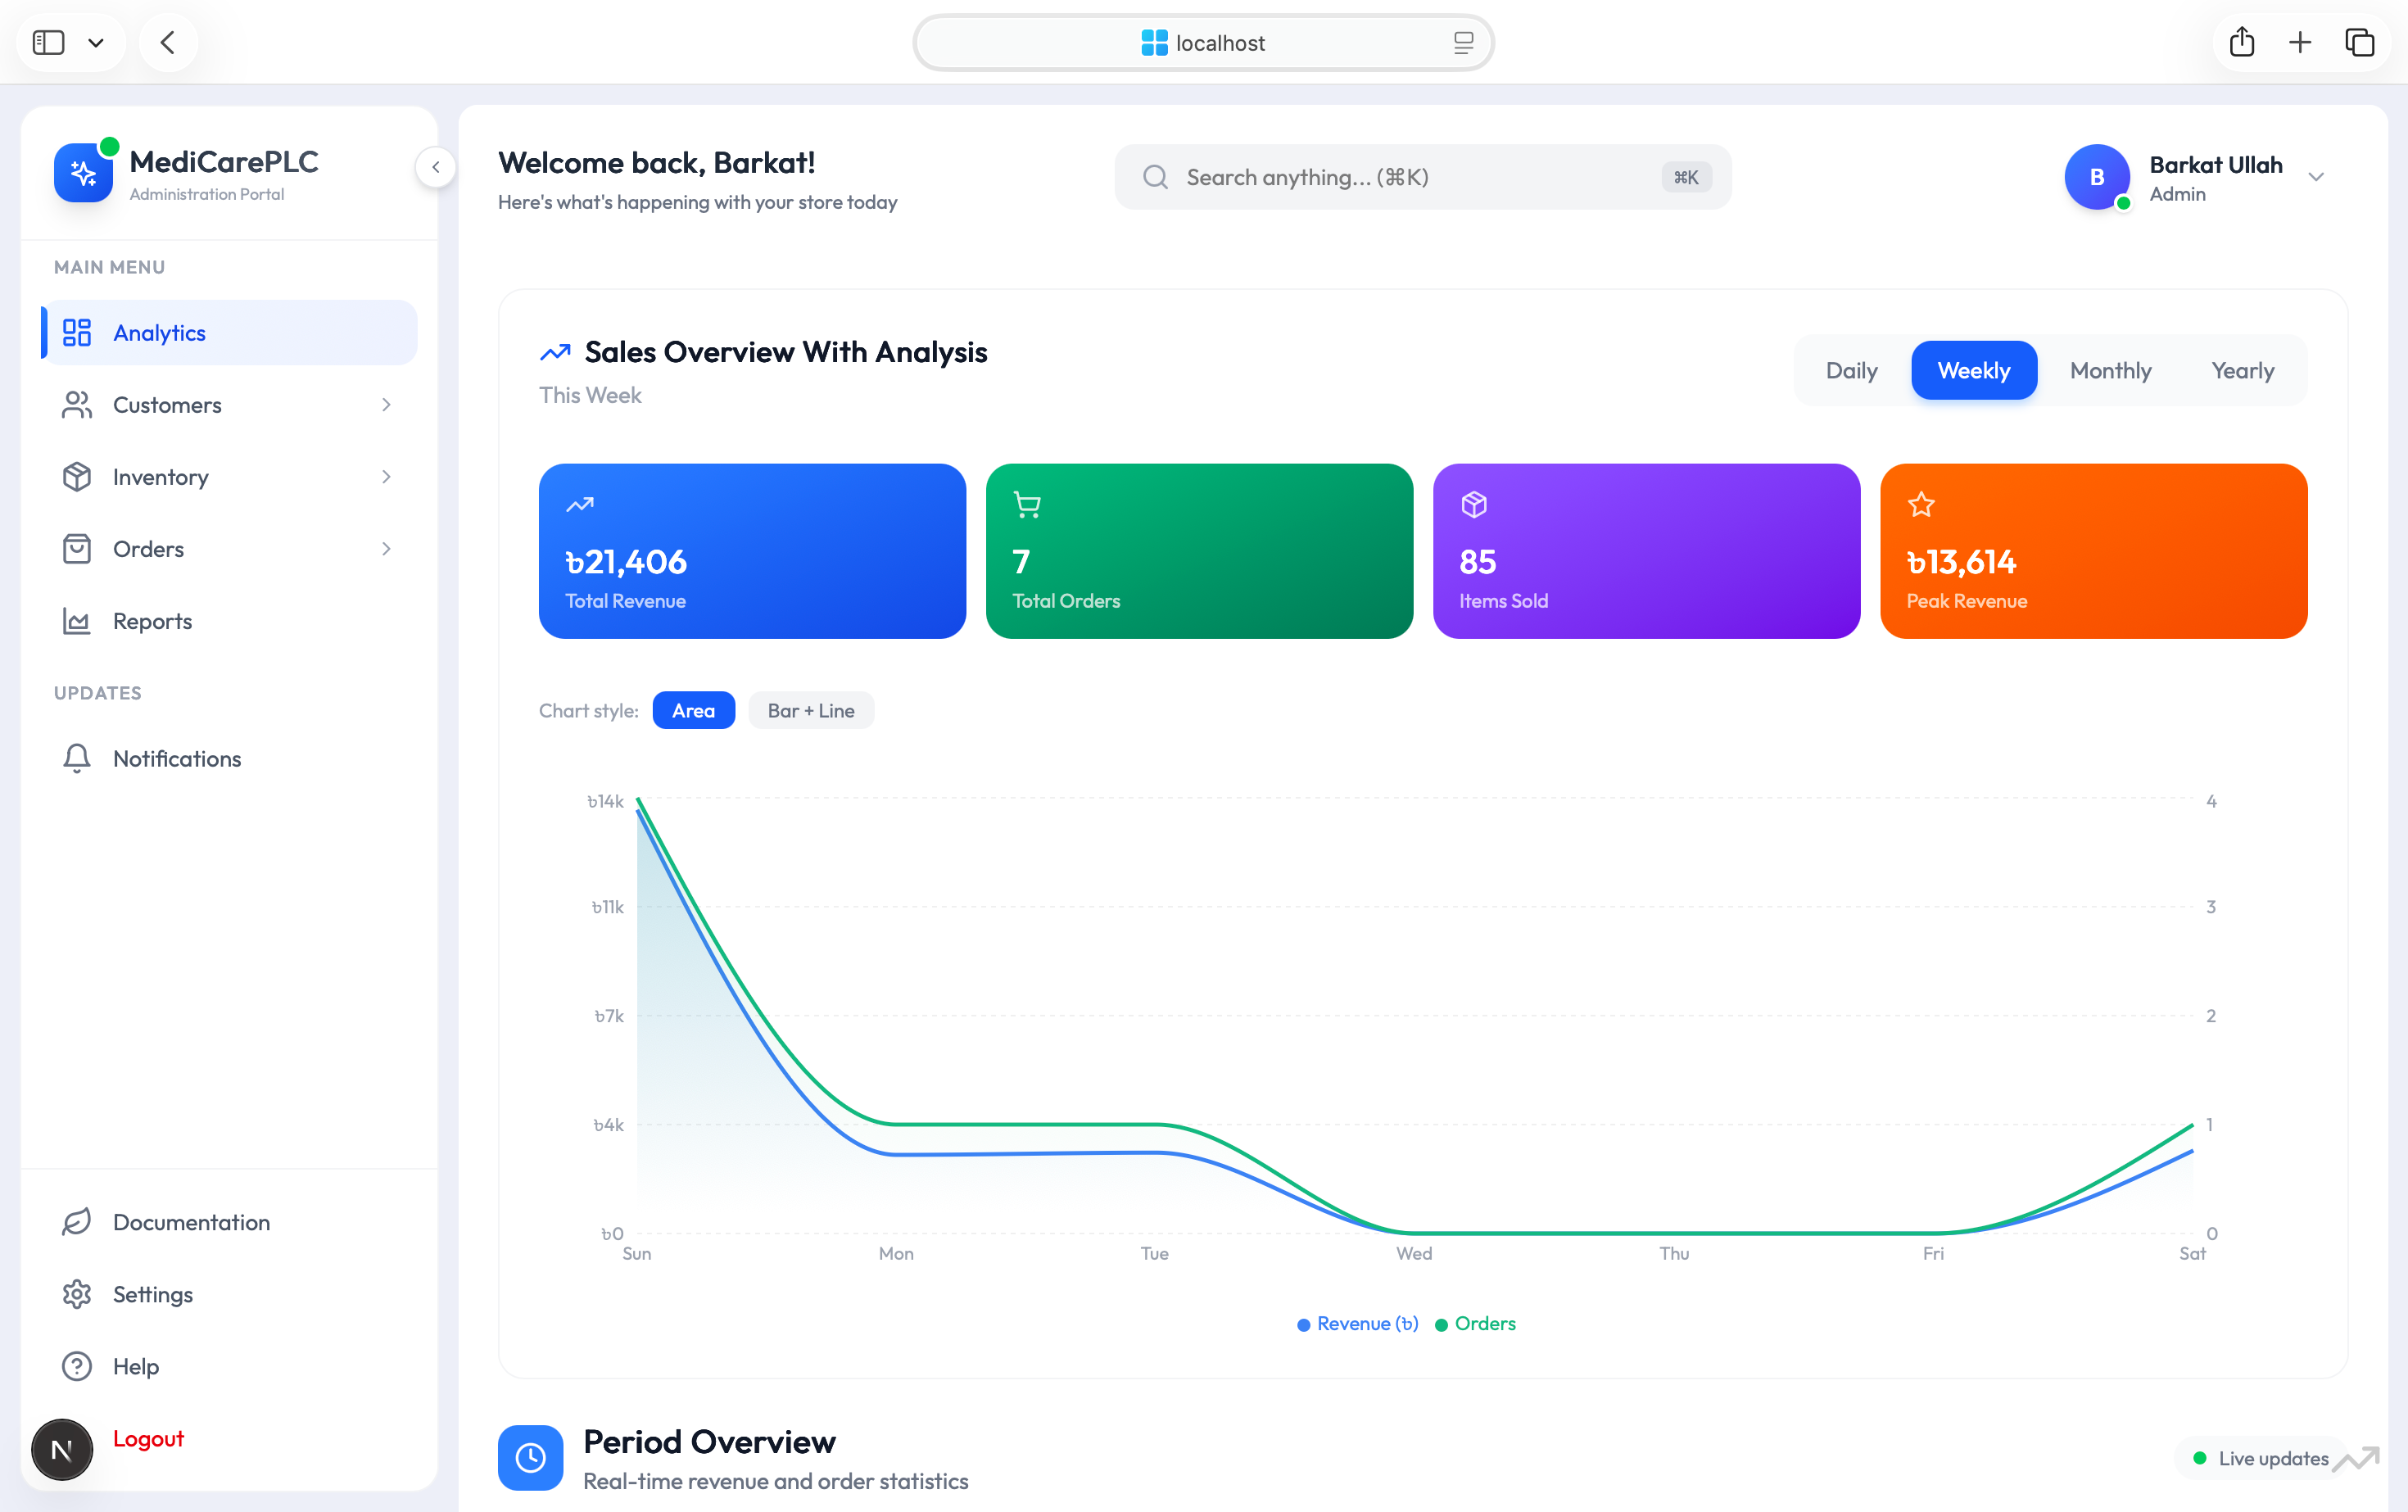
Analytics & Sales Overview
This is the main dashboard overview where administrators can quickly monitor business performance in real time. We implemented an interactive analytics chart using Recharts to visualize daily, weekly, and monthly trends, allowing admins to easily track the relationship between order volume and revenue growth. At the top of the dashboard, key performance cards provide a clear snapshot of essential business metrics, helping teams make faster and more informed decisions.

Period Overview & Lifetime Metrics
To help administrators understand business growth and performance trends, we developed dynamic analytics components that compare key metrics across multiple time periods, including Today, This Week, and This Month. This makes it easy to identify patterns, measure progress, and evaluate business performance at a glance.
Below the analytics section, the lifetime statistics panel provides an overall view of the platform’s growth by displaying total registered users and the total number of products sold since launch. These insights help administrators track the scale and long-term success of the business.

Order Status & Top Performers
This section helps administrators monitor order processing and identify top-performing products. On the left, we implemented a responsive donut chart that visualizes order distribution across different statuses such as Pending, Processing, Shipped, and Delivered. This gives admins a quick overview of operational performance and order fulfillment progress.
On the right, custom horizontal bar charts showcase the best-selling and highest-revenue medications. By highlighting top-performing products, the dashboard helps administrators make informed inventory decisions, optimize stock levels, and focus on products that generate the most business value.

Customer Pipeline Management
To keep the system secure and maintain clean user data, we avoid letting automated registrations become active immediately. Instead, we built this panel as an approval queue for new sign-ups.
Here, admins can quickly review key user details such as name and contact information. With simple action controls, they can either verify the account and activate it in the system or remove it entirely from the database. This helps us keep the platform secure, reliable, and free from unwanted or spam registrations.

Active Customer Records
Once an account is approved, it is listed in this centralized ledger view. This screen provides a structured table of all active pharmacies and user accounts registered on the platform.
To improve usability, we implemented a fast search system at the top of the table. This allows administrators to quickly locate specific users by email, business name, or phone number. The goal is to make user management efficient, scalable, and easy to navigate even as the dataset grows.

Main Product Inventory
This screen manages our large-scale digital warehouse system. It provides a real-time overview of total active product listings and highlights critical issues such as low or out-of-stock items.
Each product entry is presented with key details including product images, category tags, base pricing compared against discounted pricing, and current stock levels. To improve readability and decision-making speed, we use clear color-coded status badges for inventory conditions. This setup helps administrators quickly assess stock health and maintain smooth inventory operations.

Catalog Management Grid
A closer look at the table structure shows how we designed it to handle large inventory datasets without losing clarity. The columns are kept fixed and consistent, so administrators always know where to find key information while scanning long lists of products.
On the right side, we added clear action controls for each row. These allow admins to quickly edit product details, mark items as favorites for priority handling, or delete listings when they are no longer needed or have become obsolete. This keeps inventory management fast, structured, and easy to maintain even at scale.

Trending Products Configurator
This interface allows administrators to directly influence product visibility and buying behavior on the Flutter mobile app. By marking selected items as “Trending,” those products are promoted into a dedicated grid designed to highlight high-demand or strategically important listings.
Each featured item automatically displays calculated discount information in a clear percentage format, showing customers exactly how much they save. This structured presentation helps improve product attractiveness, increases user engagement, and ultimately supports higher conversion rates across the platform.

Featured Products Manager
Similar to the trending section, we built this layout to give administrators full control over the main banner carousels in the mobile app. It is designed to feature high-value products prominently on the homepage, ensuring better visibility for strategically important inventory.
Each banner item displays key information such as current market value and available stock count, helping admins make informed decisions while curating the homepage experience. This setup allows us to maintain a premium, well-organized storefront that improves both user engagement and product exposure.

Category List With Add Category
We built a high-level inventory categorization table to organize pharmaceutical companies and their associated product lines in a structured way. At the top, summary cards display key operational metrics, including empty or underutilized categories, helping administrators quickly identify areas that need cleanup or restructuring.
The table itself includes custom badge components that reflect live product counts for each supplier, along with database identifiers for precise tracking. We also added quick-action controls to make data updates and modifications fast and seamless, ensuring efficient management of large-scale inventory records.

Active Order Management Matrix
This serves as the core dispatch center where we track all real-time transactions and order processing activity. To streamline operations, we implemented status-based filtering tabs such as Pending, Confirmed, and Shipped, allowing the team to quickly segment and handle workloads without delay.
Each row is designed to present essential order details clearly, including whether the customer selected Cash on Delivery (COD). We also integrated direct action controls that let admins instantly print invoices, generate receipts, or update order status in real time. This ensures fast execution and smooth order lifecycle management across the system.

Active Orders List
The bottom section of the active sales list focuses on a clean and distraction-free pagination system. We designed it to handle large transaction datasets efficiently by breaking them into smaller, manageable pages.
This approach improves performance by preventing heavy data loads on a single view, while still giving administrators full access to complete transaction history across all pages. It ensures smooth navigation, faster rendering, and a more stable experience when working with high-volume sales records.

Delivered Orders Verification
This section represents a locked historical record of completed transactions. We designed it to filter out ongoing operational noise and focus only on fully completed, successfully shipped, and fully paid orders.
The summary metrics at the top update automatically, providing real-time insights into true earned lifetime revenue and total fulfilled product units. This ensures administrators always have an accurate financial and operational snapshot of finalized business performance.

Cancelled Orders & Lost Revenue Tracking
We built a dedicated dashboard view specifically for failed sales to ensure these cases are not overlooked. Instead of hiding cancelled or unsuccessful orders within general logs, we isolate them into a focused screen for clearer analysis.
This view also calculates an estimated loss metric, giving administrators a direct understanding of potential revenue impact. By structuring failed transactions separately, we can quickly identify customer churn patterns or payment drop-offs without needing to manually inspect database records or logs. This makes issue detection faster and supports better decision-making around retention and payment flow improvements.

Realtime 24-Hour Product Reports
We designed a clean, quick-glance daily breakdown component inside the main Reports hub to give administrators a clear view of day-to-day sales activity. It displays every medication sold in the last 24 hours, along with exact quantities dispatched from the warehouse.
Each entry also includes total earnings generated per item, allowing admins to quickly understand what is moving fastest and contributing most to daily revenue. This makes it easier to monitor real-time demand trends and overall operational flow without digging through detailed reports or raw data.

Periodic Revenue Analytics
We focused heavily on visual timelines in this section. Using Recharts, we built a continuous monthly sales trend line chart to clearly show performance peaks and dips over time.
Below the main visualization, we added a custom date-range picker so admins can filter and isolate financial data for any specific time window. This gives full control over how the revenue trends are analyzed without changing the underlying dataset.

Top Selling Medicines & Order Breakdown
We structured this view into two highly actionable analytical cards to improve decision speed and clarity.
On the left, we built a custom product performance list that highlights the highest-grossing items. Each entry includes inline visual progress indicators that represent individual contribution to total revenue, making it easy to understand product-level impact at a glance.
On the right, we added a clean donut-style distribution chart to represent order status breakdown across the system:

Category Performance & Discounts Tracking
We added a horizontal bar chart to show the most profitable manufacturing categories in a clean, comparable way.
At the bottom, we included simple financial cards comparing total discount value against total items shipped, giving a quick snapshot of pricing impact versus overall fulfillment volume.

Centralized Admin Notification Hub
This is the communication dashboard we built to manage system-wide and user-specific notifications. It includes quick-action buttons in the top-right corner for sending targeted messages to individual accounts or broadcasting system-wide announcements.
When there are no active alerts, the interface switches to a clean empty state with a simple vector illustration, keeping the workspace minimal and distraction-free while maintaining a polished user experience.

Profile Information
We built a centralized management panel where the logged-in administrator can update their personal credentials, security settings, and interface preferences in one place.
The layout is split into clear, modular widget blocks to avoid clutter and keep navigation simple. Each section is focused on a specific function, making it easy to manage account security and system preferences without confusion.
Key Features
- Centralized admin dashboard for complete system control
- Real-time order tracking with status-based workflows (Pending, Confirmed, Shipped, Delivered)
- Advanced analytics with interactive charts for sales, revenue, and inventory trends
- Dynamic inventory management with live stock updates and category tracking
- Product performance insights highlighting top-grossing and high-demand items
- Approval system for new user registrations with secure verification workflow
- Failed order analytics with estimated loss tracking to detect churn and drop-offs
- Comprehensive transaction ledger with searchable user and business records
- Historical revenue tracking with lifetime earnings and fulfillment metrics
- Daily sales reporting with 24-hour medication-wise breakdowns
- Trend control system for featured products and homepage promotions (Trending items & banners)
- Banner and carousel management for mobile app content curation
- Warehouse analytics with category-level profitability visualization
- Discount vs shipment comparison metrics for financial clarity
- Communication module for system-wide announcements and targeted messaging
- Role-based admin tools for account, security, and preference management
- Clean pagination and performance-optimized tables for large datasets
- Empty-state UI handling for better UX when no data is available
- Scalable architecture designed for high-volume pharmaceutical e-commerce operations
Technology Stack
Project Links
Project Type
Let's Build Together
We craft digital experiences that drive real business results
Like What You See?
Check out more of Our projects or let's discuss your next big idea.